Enhancing Decision Making with a Holistic System View
How did we create a dashboard to provide users with an overview of their Nexus Dashboard Orchestrator's environment?
Cisco
Interaction Design
UX Research
Visual Design
Product Manager
Marketing Team
Developers
QA Team
6-8 weeks
Challenge
Users currently lack a comprehensive overview of their network environment. They struggle to understand the overall health, status, and interdependencies of their deployed templates, sites, and other objects. This limited visibility hinders effective troubleshooting, optimization, and proactive management of network operations.
Goal
User Goal: Users aim to gain a comprehensive understanding of their network environment to efficiently troubleshoot, optimize, and manage network operations.
Business Goal: To enhance user satisfaction and drive product adoption by providing a clear and actionable overview of the network environment within the Nexus Dashboard Orchestrator.
By fulfilling these goals, we can improve operational efficiency and reduce support costs.
Solution
To address the lack of comprehensive network visibility, we developed a dashboard providing a clear overview of the NDO instance. This centralized view offers real-time insights into template deployment status, associated sites, and potential issues.
This enhanced understanding of network operations and configurations enables users to make more informed decisions and optimize network performance.
Key Findings through interviews
To gain a deeper understanding of user needs and challenges, we conducted extensive user research. This involved interviewing Product Managers, Marketing teams, and our subset of the larger user base – Cisco Network Administrators. We engaged in insightful conversations with administrators, asking questions like:
"How easily can you pinpoint the causes of failed deployments before they occur?"
"How do you determine the number of switches, controllers, and sites you are managing?"
"What is your current process for understanding the interconnectivity between different sites within your network?"
These conversations provided invaluable insights into the specific challenges administrators faced in managing their network infrastructure.
58%
Limited System Visibility
Of users struggled to quickly assess key network metrics and overall system health, hindering efficient decision-making.
60%
Delayed Issue Detection
Of users struggled to efficiently identify network components requiring attention, leading to delayed issue resolution and potential service disruptions.
Brainstorming
After many sessions (and some serious noodle-scratching), our goal was to pick out the key stats to show. We made a huge list, then sorted them into four groups, and the whole team pitched in to make them super clear and snazzy!
Brainstorming session with the Product Manager (Carlos), Design Manager (Dan) and the design team
Designs
We took those sorted stats and started doodling out rough sketches (like drawing on a napkin at lunchtime). This back-and-forth helped us iron out any wrinkles and fine-tune our designs.
Map View
The map lists managed sites, their connections, audit log summary, and high-level statuses of site interconnections, and other objects. Refer fig 1.0
Fig 1.0 Map View
Sites
Providing users with a quick overview of the sites managed by Nexus Dashboard Orchestrator, including inventory details, connections to other sites, and general information. Refer fig 1.2
Fig 1.2 Sites View
Tenants
Users can view the various types of templates associated with a specific tenant by hovering over each block. Refer fig 1.3
Fig 1.3 Tenants
Templates
Offering users template (group of network policies) statistics, which are broken down into status by type, state, and status. Refer fig 1.4
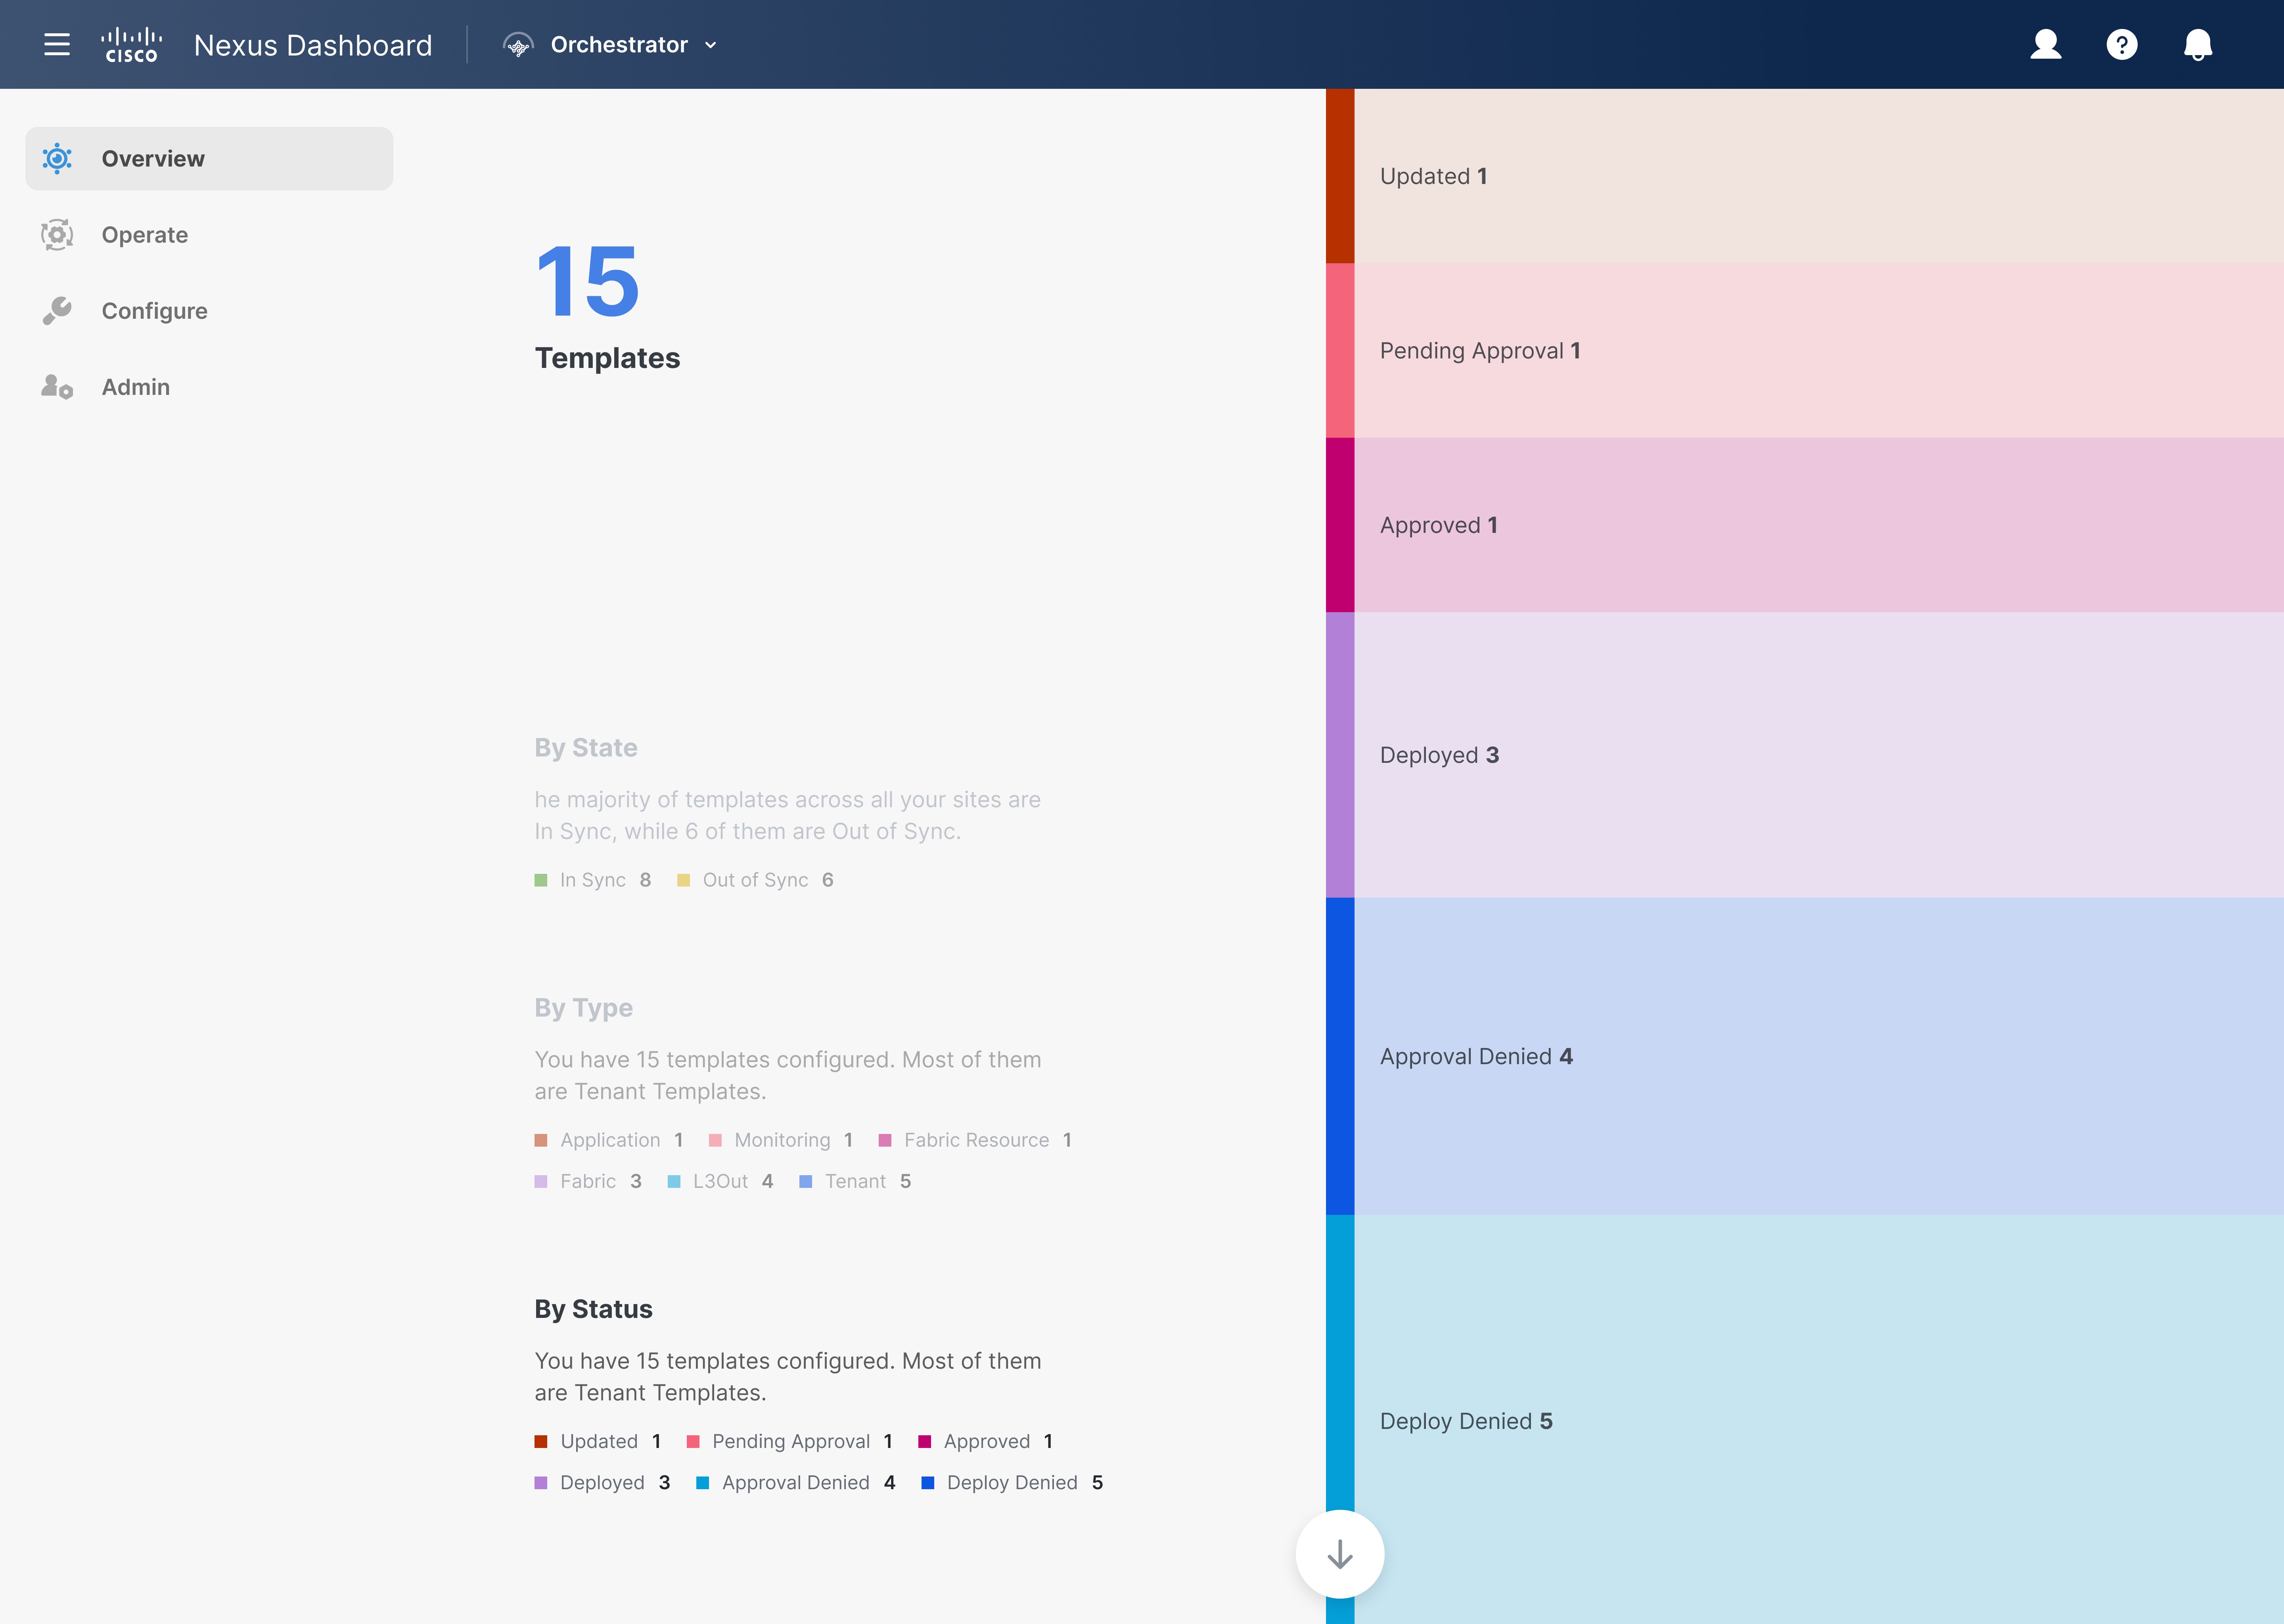
Fig 1.4 Templates
Inventory
Providing users with a structured breakdown of inventory, categorizing it into controllers, switches, interfaces, and L3 neighbors. Refer fig 1.5
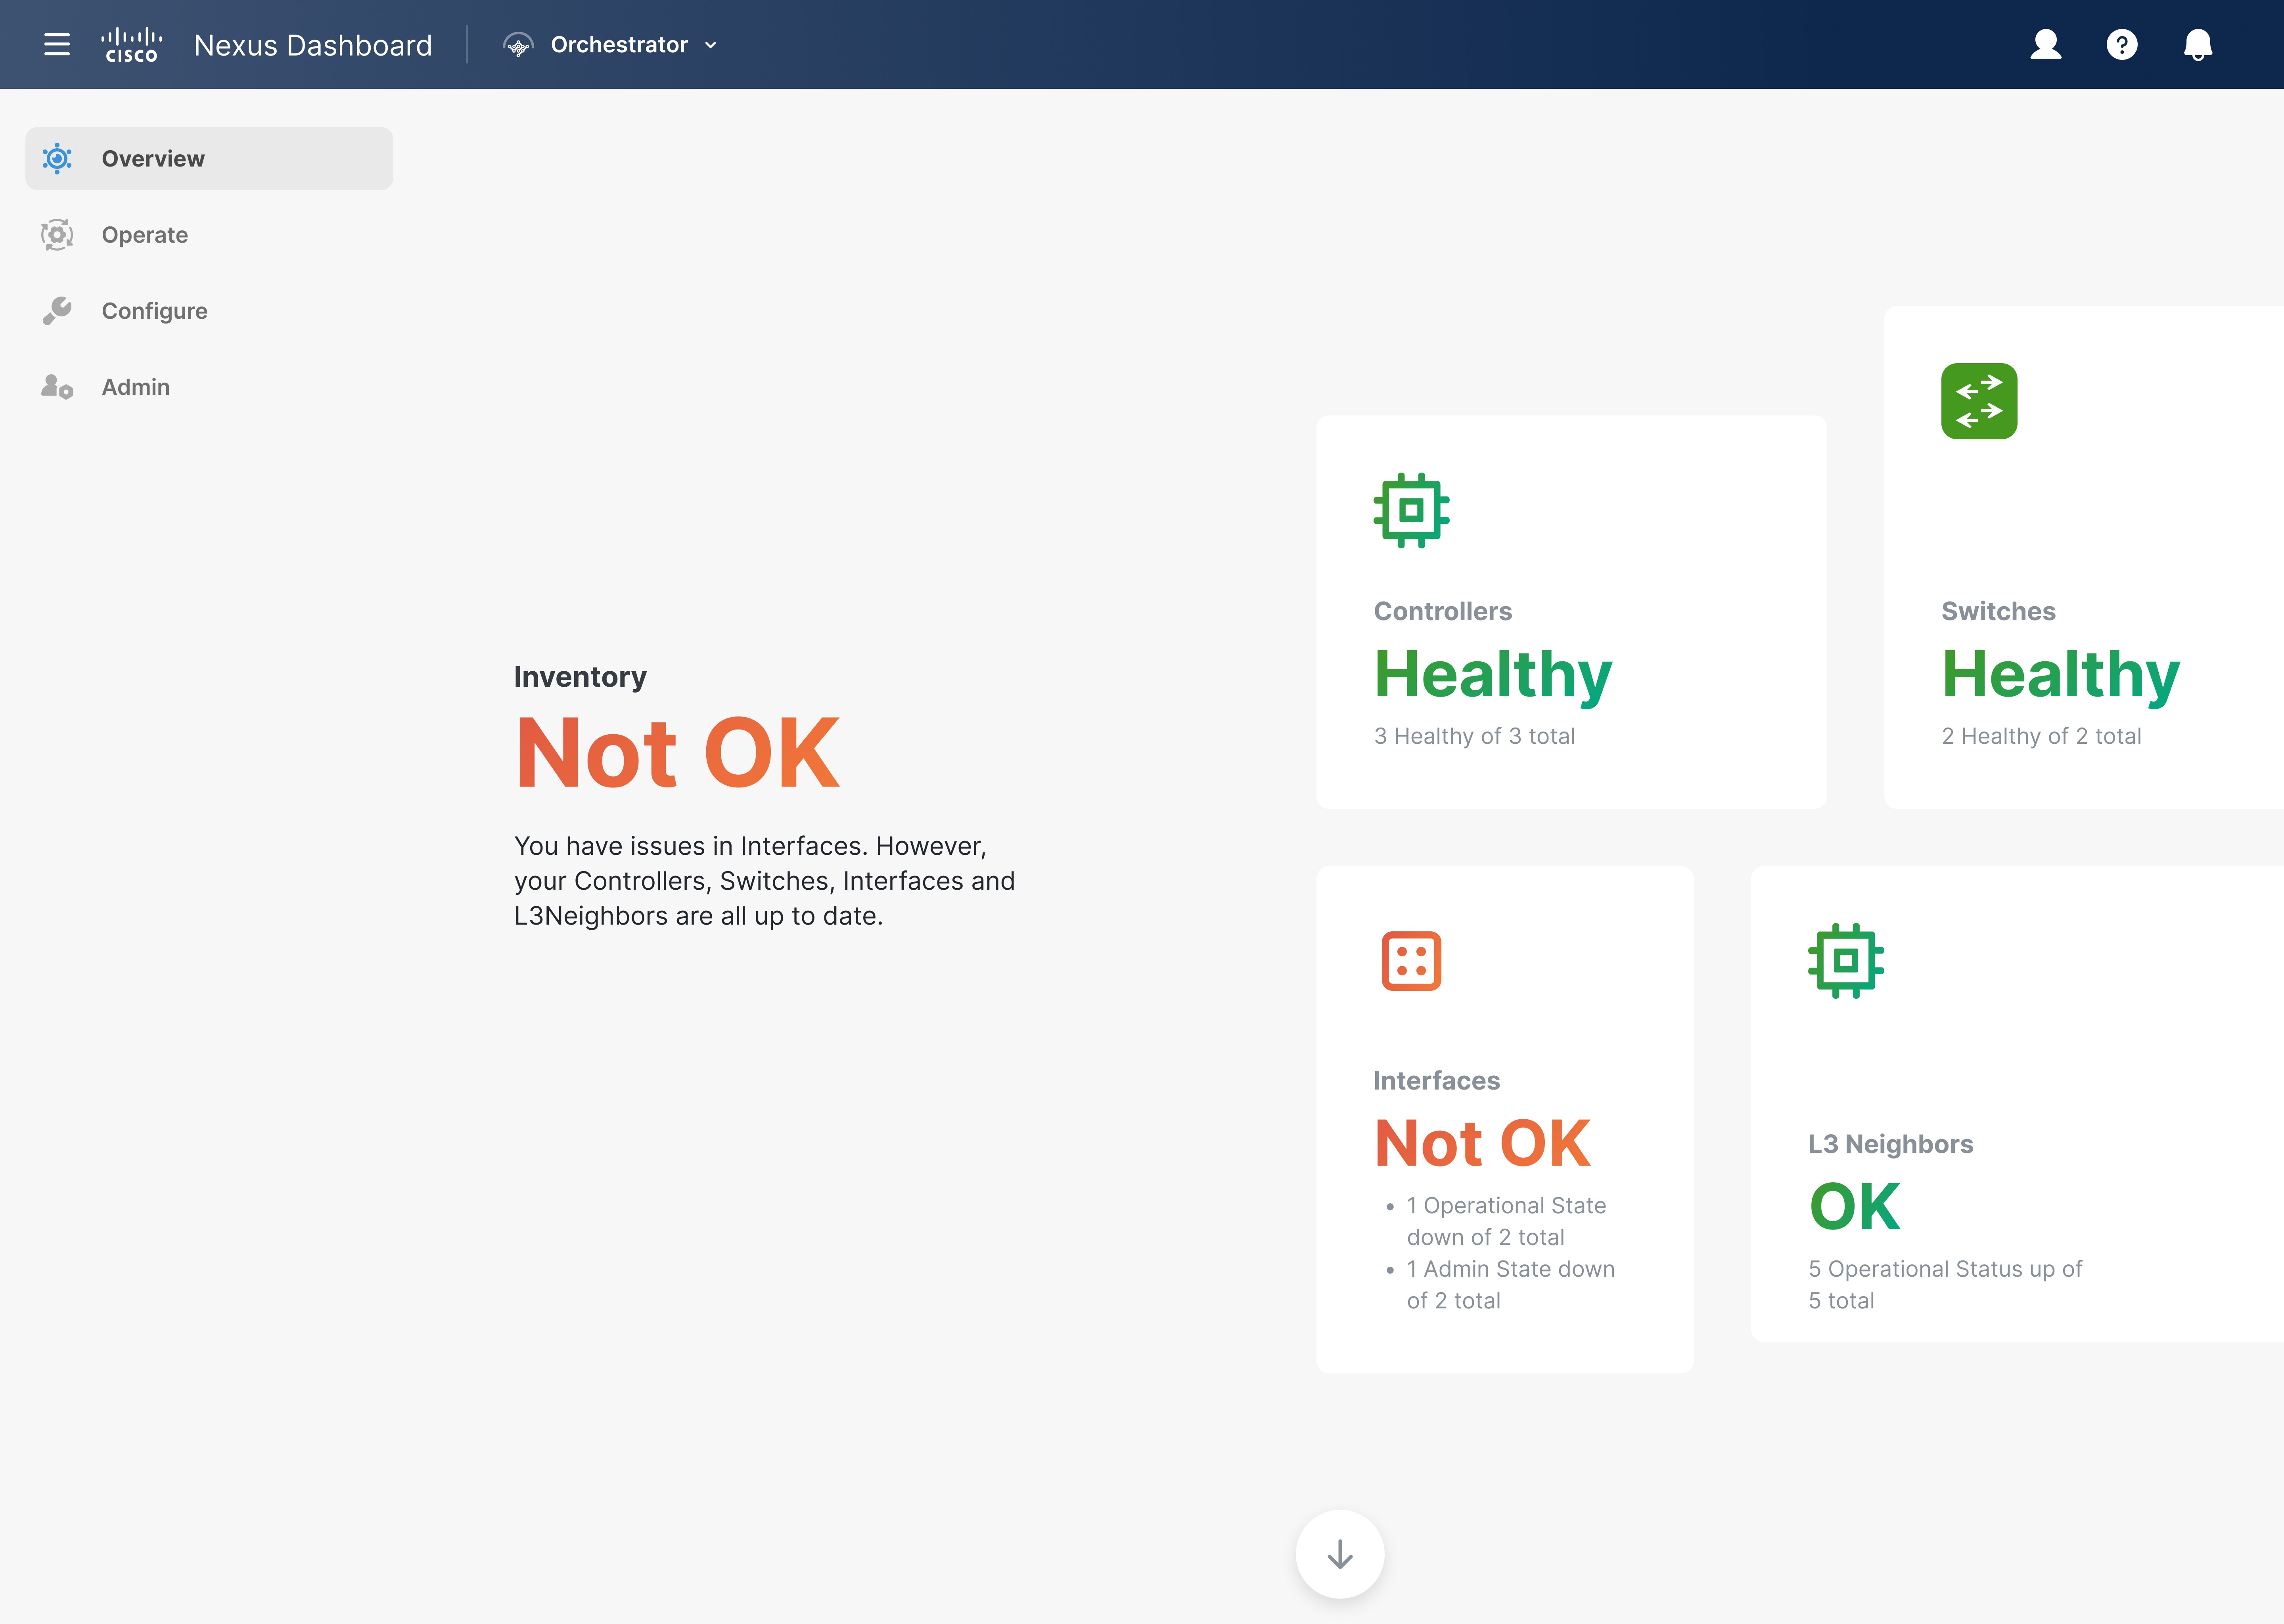
Fig 1.5 Inventory
User Testing and Impact
Following several rounds of iterations involving all stakeholders, once the designs were finalized, our research and marketing team employed them to gather feedback from our customers.
35%
Enhanced High-Level Overview
Of users found it useful for quickly reviewing key insights. It also aided in understanding the status of the NDO instance.
25%
Easy to Identify Critical Configuration
Of users found it simple to identify sites, tenants, or policies needing attention, whether for configuration or deployment purposes.
Conclusion
In conclusion, we met our goal of providing a clear overview of the Nexus Dashboard Orchestrator (NDO) instance. Users can now quickly grasp key details like template deployment, related sites, and template issues.
As a result, it simplifies understanding network operations and settings, enabling users to make better decisions and enhance network performance more effectively.